
Introduction
Patient reported outcomes (PRO) have been used in clinical trials for many years, but it is only recently that electronic (ePRO) collection has become possible. The advantage for trials is the potential for on-the-spot measurement of endpoints that are characterized as a set of symptoms, reportable by patients. This decentralized data collection has the potential to be more precise in pin-pointing the start and duration of events.
PRO: “Any report of the status of a patient’s health condition that comes directly from the patient, without interpretation of the patient’s response by a clinician or anyone else”[1]
Phastar are supporting several multi-center multinational prevention trials being sponsored by a pharmaceutical company in the respiratory field. In these trials, the primary endpoint is a count of a respiratory event in children. Types of events include Respiratory Tract Infection (RTI), Asthma exacerbation, and Wheezing episodes (WE). These events may be characterized by a set of symptoms, in combination with certain medications.
In the sponsor’s previous studies, data were collected at sites on a monthly basis – this had different cost implications; there was a potential for recall bias; and it could be difficult for families to commit to. ePRO is a novel alternative, which could solve some of these issues. However, it presents some challenges. Are all symptoms reported? Do missing data lead to missed events? Are events derived from these data true events?
Examples of endpoints derived using ePRO
The approach taken for measurement of events, has been to predefine a strict definition of what an event is in terms of patients’ symptoms, severity of symptoms, duration of symptoms, and medication taken. Symptom questionnaires for RTIs are based on the Wisconsin Upper Respiratory Symptom Survey for Kids (WURSS-K)[2]; other questionnaires have been developed in consultation with leading respiratory experts.
ePRO data are collected using portable handsets, or an app installed on a smartphone. Families are given training in how and when they should complete their diaries.
Example 1: Wheezing Episodes
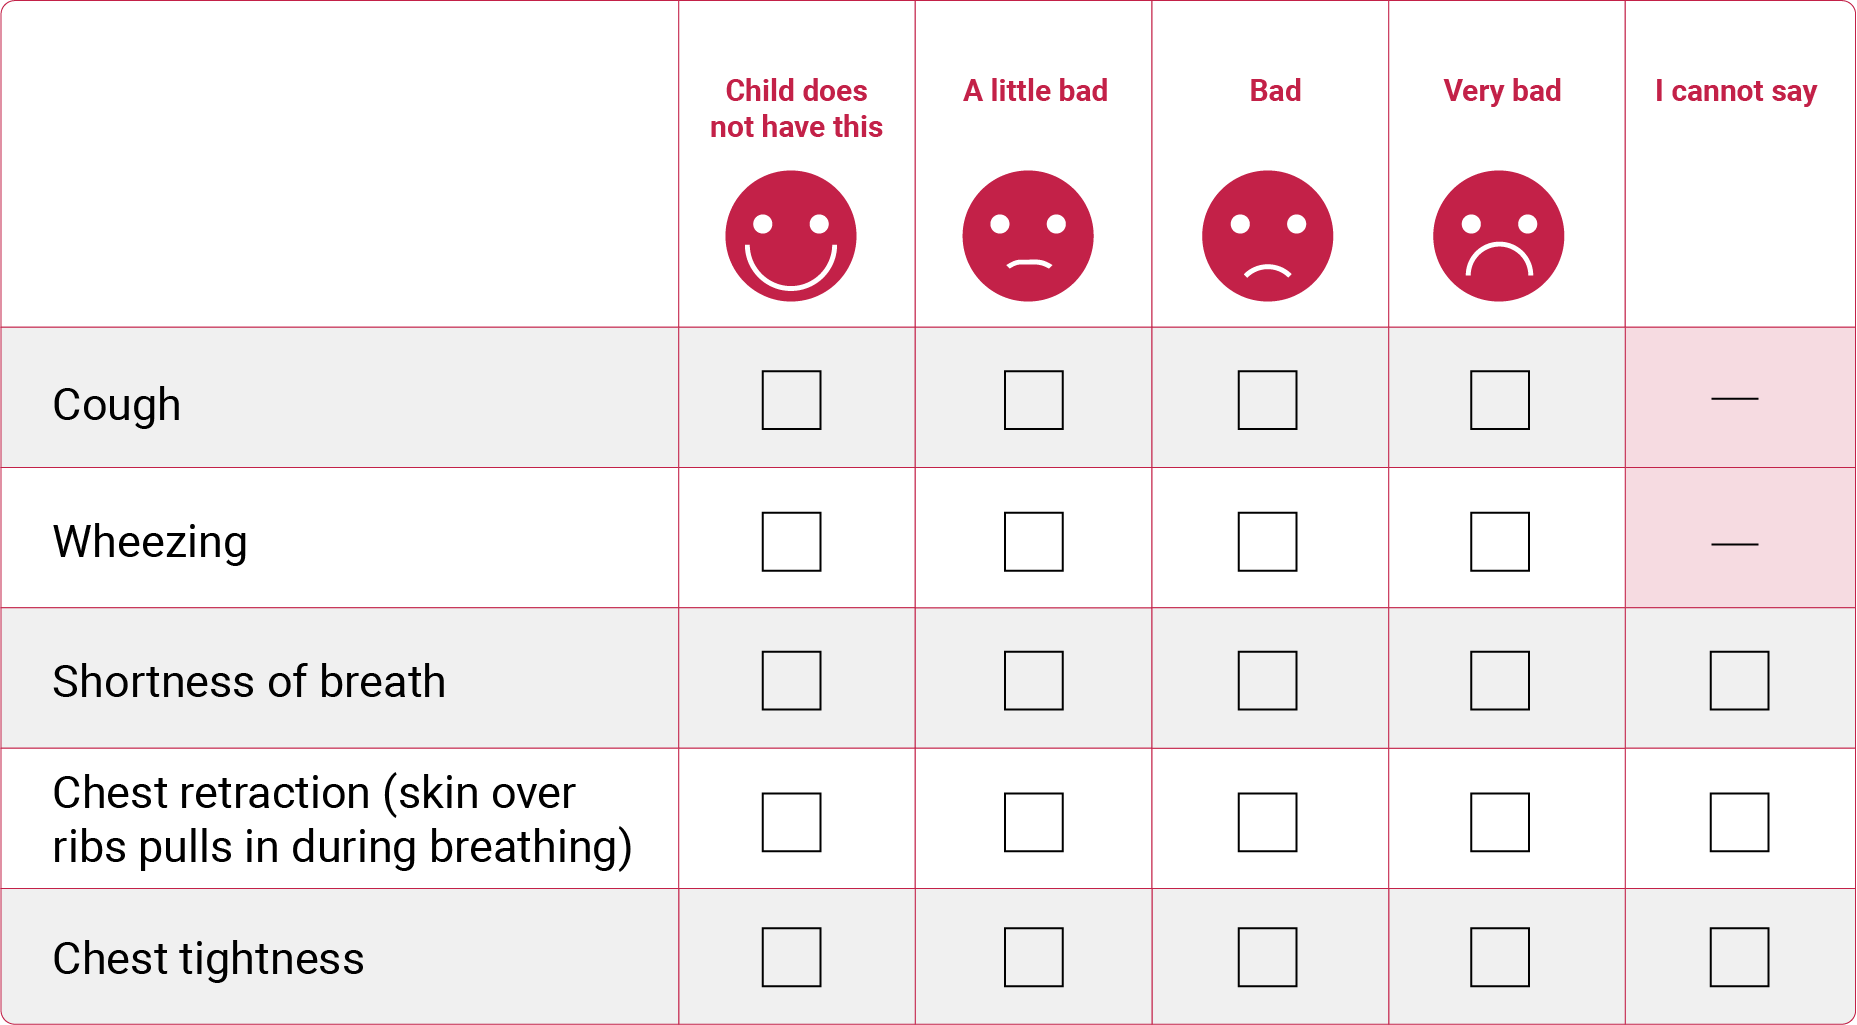
An episode of wheezing (WE) is defined as wheezing OR cough with one or any combination of the following additional symptoms: shortness of breath, chest retraction or tightness; that either:
Requires at least two β2-agonist (e.g., albuterol) treatments and lasts at least 24 hours; OR
Requires one of the following: a) 1 course of oral corticosteroids, or b) 1 visit to the Emergency Department or hospitalization
Two WEs will be counted as multiple episodes if the patient is without symptoms for at least one week between the end of one episode and the beginning of another.
Method of data collection: Families receive either a hand-held device or install an app on a smartphone.
On a day that a child is sick their family should:
Record any wheezing symptoms and medication/medical care required:
Example 2: Respiratory Tract Infection
A respiratory tract infection (RTI) is defined as the presence of at least one of the following:
≥1 symptom(s) of severe severity (very bad) and fever
≥2 symptoms of moderate severity (bad) and fever
≥3 symptoms of mild severity (a little bad) and fever
where symptoms are collected from the WURSS-K questionnaire, other RTI-related symptoms questionnaire, and a fever is defined as a tympanic temperature of ≥37.5°C. Conditions should be met for at least 24 hours as documented in the subject’s diary (or two consecutive days of symptoms as recorded in the diary) and multiple RTIs will be counted only if the subject is without symptoms for at least one week or 7 consecutive days as recorded in subject’s diary.
Method of data collection: Families receive either a hand-held device or install an app on a smartphone.
On each day, patients and their families should:
Answer the question: “How sick do you feel today?”
If the response is “Not Sick”, then no further input is required. Otherwise, they are asked to complete a series of questionnaires
Example of symptom reporting using the WURSS-K questionnaire
Some challenges faced, and solutions offered
Although patient-reported data have been used for many years in clinical studies it was the COVID-19 pandemic that accelerated the development of remote electronic data collection. There is now methodology for vast amounts of data to be collected in real time. It’s tempting to see this as a big leap forward in capturing endpoint data that are meaningful to the populations under study. However, we are still learning about the challenges and implications for the integrity of studies that look to rely on these types of data.
The first consideration is validity and reliability. Is there potential for bias? How are technical problems dealt with and overcome? Can the measurement tool be considered valid for the estimand under study? Is reporting subjective, and relative to participants’ context? In designing a study where the primary endpoint relies on ePRO, it is of great value to understand the measurement tool within the population of interest as fully as possible. This can be achieved through relatively small feasibility studies. Such studies should also include pilot data collection to be used for sample size calculations.
A second consideration is having a plan in place to monitor the quality of ePRO data during the course of a study, with particular focus at the start. Where monitoring indicates risks to study integrity, mitigation measures may need to be implemented. Key aspects that needed to be monitored in the studies we have been supporting were: compliance of families to complete diaries as expected; whether the primary endpoint is affected by poor compliance (are events missed as a result?); are diaries completed accurately? Being able to visualize and quantify missingness regularly is a key monitoring tool. Where endpoints are derived from ePRO data, complex checks are required through statistical programming, as standard compliance statistics or completeness of data checks are not sufficient to quantify impact on primary endpoint measurement quality.
Solution 1: Quarterly checking of diary data quality through visualizations
We have developed bespoke visualizations for monitoring different endpoints. Below are graphs used for monitoring wheezing episodes. The patient profiles show compliance with weekly check-ins, event data derived from ePRO, and event data collected by sites through case-report forms (CRFs). The red stars indicate event data collected by sites that are missed by the diary. The cumulative event graph shows how the event count (using ePRO alone) compares with an event count derived using a combination of patient-reported and site collected data; and how these in turn compare with what we might expect to see under the original design assumptions.
Example of diary compliance visualization for Wheezing Episodes (WE)

Sites can visualize their patient’s data by looking at patient profiles. This type of graph is a great way for sites to understand compliance with respect to the primary endpoint and helps them in their conversation with families. The squares plotted indicate ePRO data. The red stars indicate potentially missed critical data.
Example of comparison of cumulative observed event rate versus expected

Cumulative frequency graphs have been key to visualizing how event counts identified from an ePRO alone compare to when site-collected data are added to support event identification. These are compared with what we would expect to see under current and future predicted recruitment if event rates follow design assumptions.
Solution 2: Quarterly checking of diary data quality through statistics and quality tolerance limits (QTLs)
In the studies that we are supporting, a key metric was developed in order to monitor the quality of ePRO data as a measurement tool for capturing events. This was an estimated percentage of events missed. Methodologies were developed to collect data on potentially missed events. Thresholds were placed on these statistics to form a QTL. In at least one study, this monitoring approach has led to site-collected data supplementing patient-reported data in the derivation of the primary endpoint.
Solution 3: Mitigation measures
Early monitoring is used to identify weaknesses in a study that perhaps could not be foreseen at the design stage. Mitigation measures therefore need to be tailored to each study in a bespoke fashion.
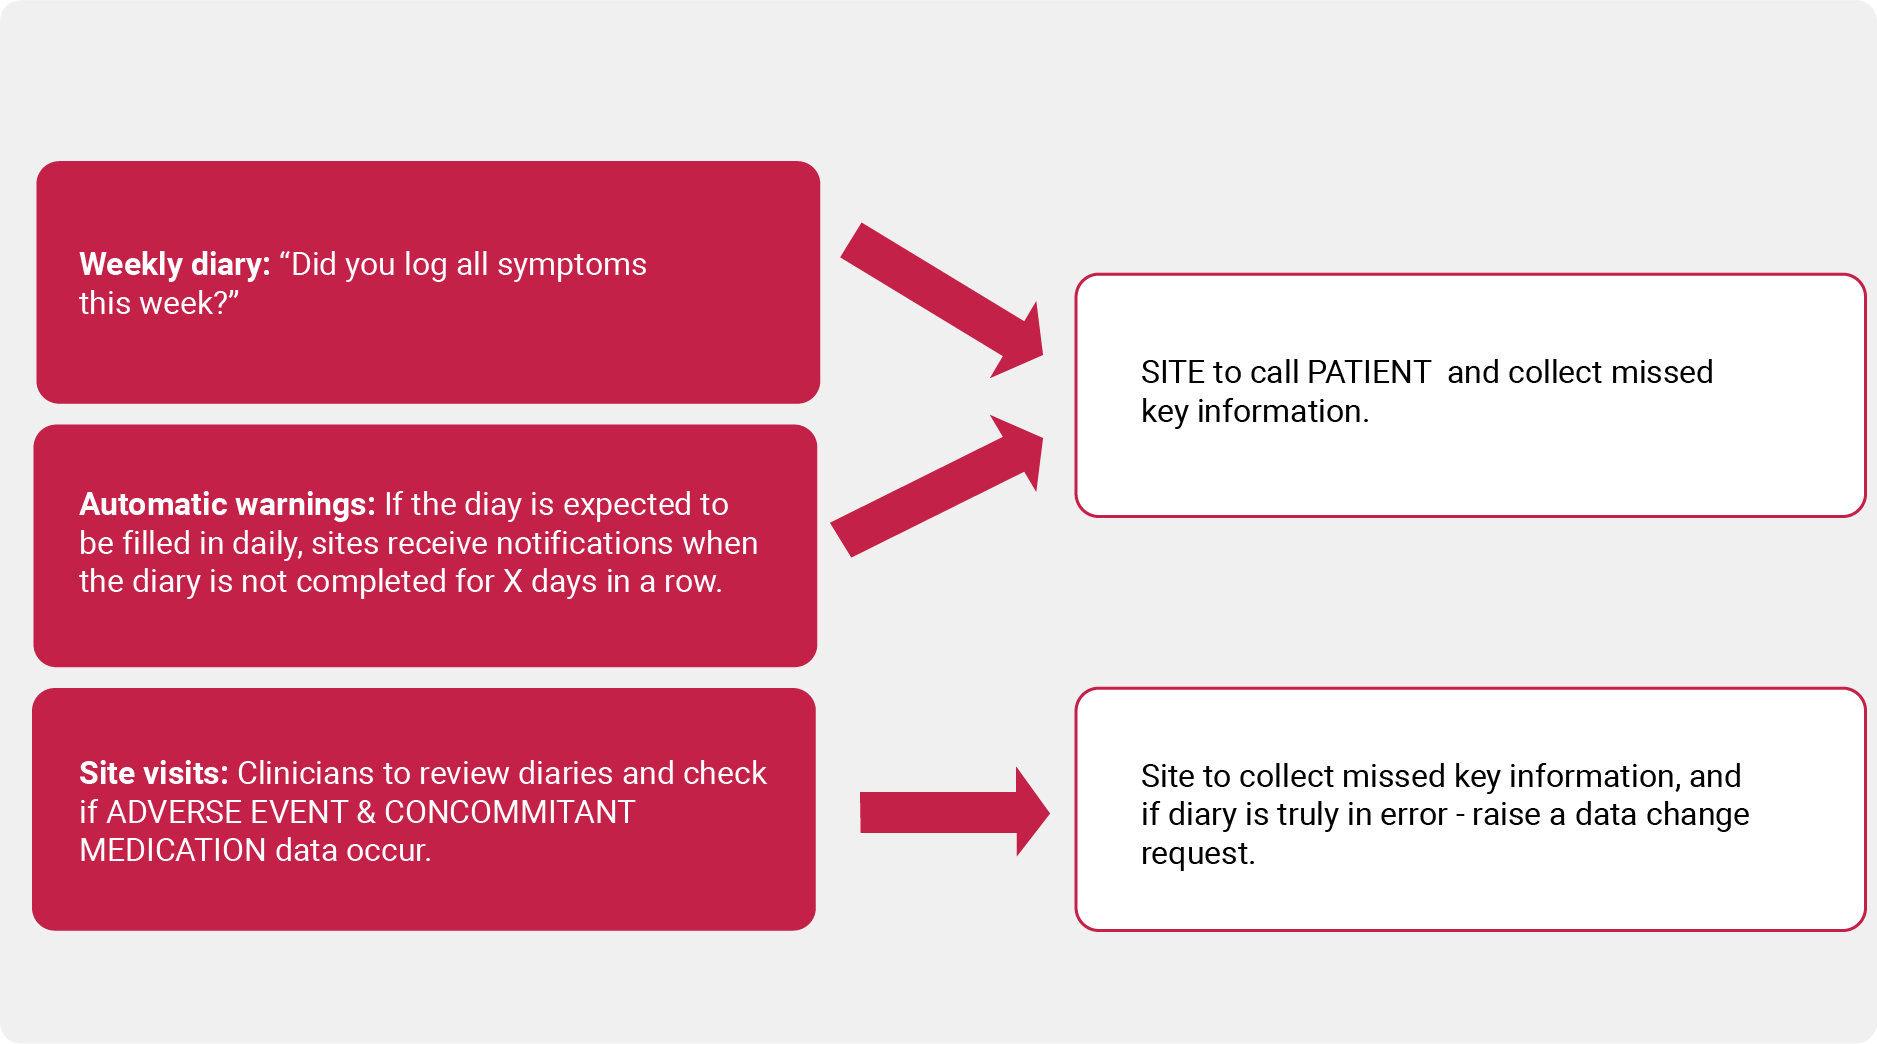
Example of mitigation strategy:
Statistical Considerations
In the respiratory studies that we have been supporting, endpoints are counts of events which are derived through combining all relevant data for each study day and comparing this with data across consecutive study days. Statistical programming has been required to derive each unique event together with a start and end date. Very detailed specifications have been included in statistical analysis plans (SAPs) to clearly set out these derivations. This includes a provision for missing diary days.
Sensitivity analyses have been planned to test the robustness of conclusions to modifications to the method for counting events. For example, if all potentially missed events are assumed to be true missed events; or if alternative definitions to derive events are implemented (there is not always consensus on exactly which combination of symptoms/severity/medications are best used to define events).
One important consideration is the question of how sample size calculation assumptions are made. For the studies we have been supporting, historical data from before the COVID-19 pandemic was the best available evidence at the design stage. It was anticipated that underlying event rates could be different post-pandemic, and sample-size re-estimation was planned for through interim analysis. However, an additional difference from historical data not anticipated was a difference in the distribution of the endpoint through the use of the different methods of data collection. It was an important learning point: that using a novel approach to identification of events may result in an endpoint that does not behave distributionally in the same way as events that are counted using site visit methods.
Finally, consideration should be made of the nature of the data being collected and how it will be processed and analyzed. Diary datasets are enormous, especially for daily symptom data reporting. Programmers should consider these as complex datasets and the programming of ADaM datasets as a complex task. Algorithmic approaches are required for deriving clinical events from symptom data. Derivations may require very detailed logic to be specified within SAPs.
Conclusions
Our experience of working on studies using ePRO for primary endpoints is to urge caution. The benefits of careful planning, based on the results of feasibility studies conducted within populations of interest, cannot be underestimated. Additional monitoring requirements should be planned and costed for – in particular, the need for statistical programming input. Although much data collection is in the hands of patients and their families, a lot of work can be required in training, monitoring, and training again to maintain participation and in turn data quality.
We would advise that some supplementary site-collected data is planned and that primary endpoint derivations incorporate these data sources in order to mitigate missed critical data when ePRO is not completed or not completed correctly. It also remains to be seen whether the benefits to patients and their families of fewer site visits compare with a potential additional burden of diary completion. We look forward to reporting on the extent to which these real-time data collection methods have improved the measurement of pediatric respiratory events.
Guidance from Regulators
The FDA[1][4], EMA[3] and the UK HRA[5] all now have guidance for decentralized trials and patient-reported outcome measures. These largely echo the experiences described above.
References
[1] FDA Guidance for Industry. Patient-Reported Outcome Measures: Use in Medical Product Development to Support Labeling Claims. 2009. Available at: https://www.fda.gov/media/77832/download. Accessed May 14, 2025.
[2] WURSS-K© (Wisconsin Upper Respiratory Symptom Survey) 2014, Created by Bruce Barrett MD PhD et al, UW Department of Family Medicine, Madison, WI 53715, USA
[3] EMA, HMA and EC: 1RECOMMENDATION PAPER ON DECENTRALISED ELEMENTS IN CLINICAL TRIALS Version 01, 13 December 2022. Available at: https://health.ec.europa.eu/latest-updates/recommendation-paper-decentralised-elements-clinical-trials-2022-12-14_en. Accessed May 14, 2025.
[4] FDA Guidance for Industry. Conducting Clinical Trials With Decentralized Elements. 2024. Available at: https://www.fda.gov/media/167696/download. Accessed May 14, 2025.
[5] HRA: Decentralised trial methods position statement, 2023. Available at: https://www.hra.nhs.uk/planning-and-improving-research/policies-standards-legislation/clinical-trials-investigational-medicinal-products-ctimps/decentralised-trial-methods-position-statement. Accessed May 14, 2025.