
Introduction
An abundant problem in clinical trials is the absence of data due to patients prematurely withdrawing from trial participation. Censoring is a common characteristic in longitudinal trials that collect time to event data. Usual methods of analysis can be implemented if the data is assumed to be censored at random (CAR). However, if this assumption is ever violated, other methods may be needed to address the robustness of conclusions about the treatment effect.
An important assumption in traditional survival analysis is that the censoring mechanism is non-informative – i.e. censoring does not provide any information regarding the survival time beyond the censor time. When the probability of censoring depends on the survival time, censoring is said to be informative, and the inference based on the standard methodologies is no longer valid.
The Cox proportional hazards model is frequently used to describe the relationship between time-to-event and one or more predictive variables, such as exposure to clinical interventions in clinical trials. If patients who withdraw are at higher risk of having an event, the survival function would be overestimated. Conversely, if withdrawals were at lower risk of failure, then the survival function would be underestimated. Therefore, informative censoring implies potential bias in the comparison of survival functions between treatment groups, particularly when there might be imbalance of informative censoring between the experimental and reference groups.
A worst-case scenario would be to assume that discontinuation of treatment can be specified as clinical failure, where patients who discontinue treatment are considered having much higher risk of a future event than other patients. The worst comparison scenario is where control patients are censored at time of discontinuation, and patients on randomized treatment are assumed to have an event at time of discontinuation. Both scenarios can be used as sensitivity analyses to assess the robustness of the study results, with the worst comparison invoking maximal stress on the treatment group.
Jackson et al, 2014 (1) propose a sensitivity analysis where patients who discontinue their assigned treatment have time to event imputed as if they continued treatment. By imputing data for those whose censoring was non-informative, standard methods can then be implemented for right censored time to event data. The method proposed relaxes the independent censoring assumption to allow flexibility in the model and incorporates a corresponding hazard parameter to measure how the conditional survival distribution can allow for different post-discontinuation behaviours for the different treatment groups. The impact of departure from the assumption of non-informative censoring can then be investigated by summarising the treatment effect as a function of this hazard parameter over a plausible range.
Method
A SAS® macro tool was created that implemented the method described in Jackson et al, 2014. Data were then simulated to emulate a range of possible study scenarios to explore how the imputation method would perform under different conditions.
Results
When running under the censoring at random assumption, the tool gave consistent results to a Cox proportional hazards model estimated from the observed (not imputed) data. The results were stable after a threshold imputation number that varied between datasets. 50 imputations were chosen as this gave stable results (<0.001 between observed and imputed hazard ratio) without affecting computational efficiency.
Sim1 is a simulated dataset with sample size of 4000, active and reference group event rates of 0.21 and 0.3 respectively, and study length of 1 year. This dataset was run alongside 3 more datasets to compare the observed and imputed HR differences.
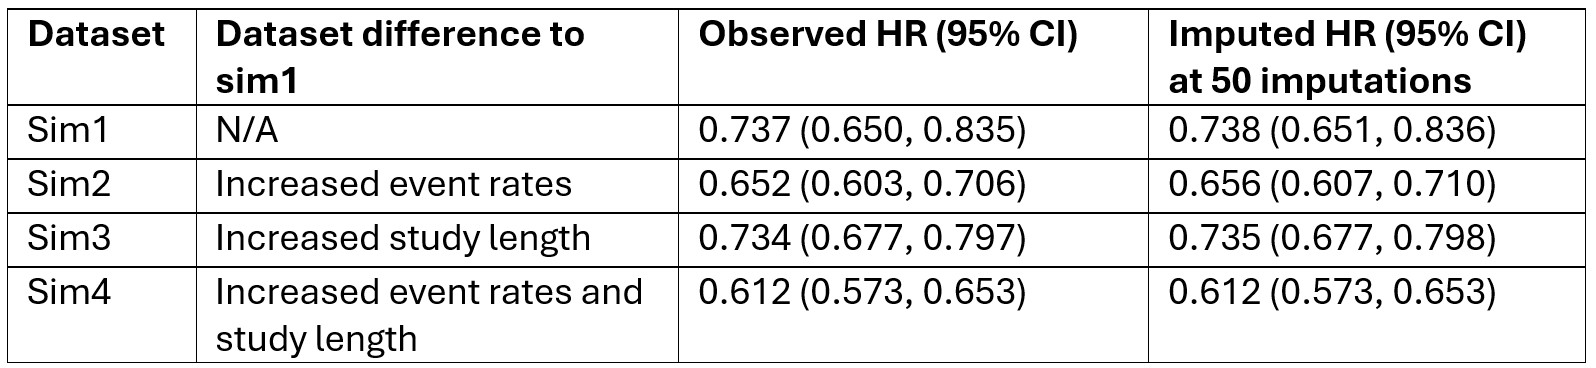
Table 1: Observed and imputed hazard ratios and 95% confidence intervals for sim1, sim2, sim3 and sim4 with variable change explained for each dataset.
All datasets have imputed HR and 95% CIs almost identical to 3 decimal places (Table 1). Therefore, the method proposed works under a CAR assumption and is appropriate to be used in future tipping point analyses. The computational error of the macro was tested and showed that from multiple runs of the macro, the imputed HR at 50 imputations did not vary more than 0.00004 from the observed HR. Therefore, the macro produces consistently plausible penalised results and is appropriate for use in future tipping point analyses.
Datasets sim1-sim8 were each run over 5-100 imputations in increments of 5 with just one penalty combination. Sim5-8 are similar to sim1-4 but with sample size of 1000.
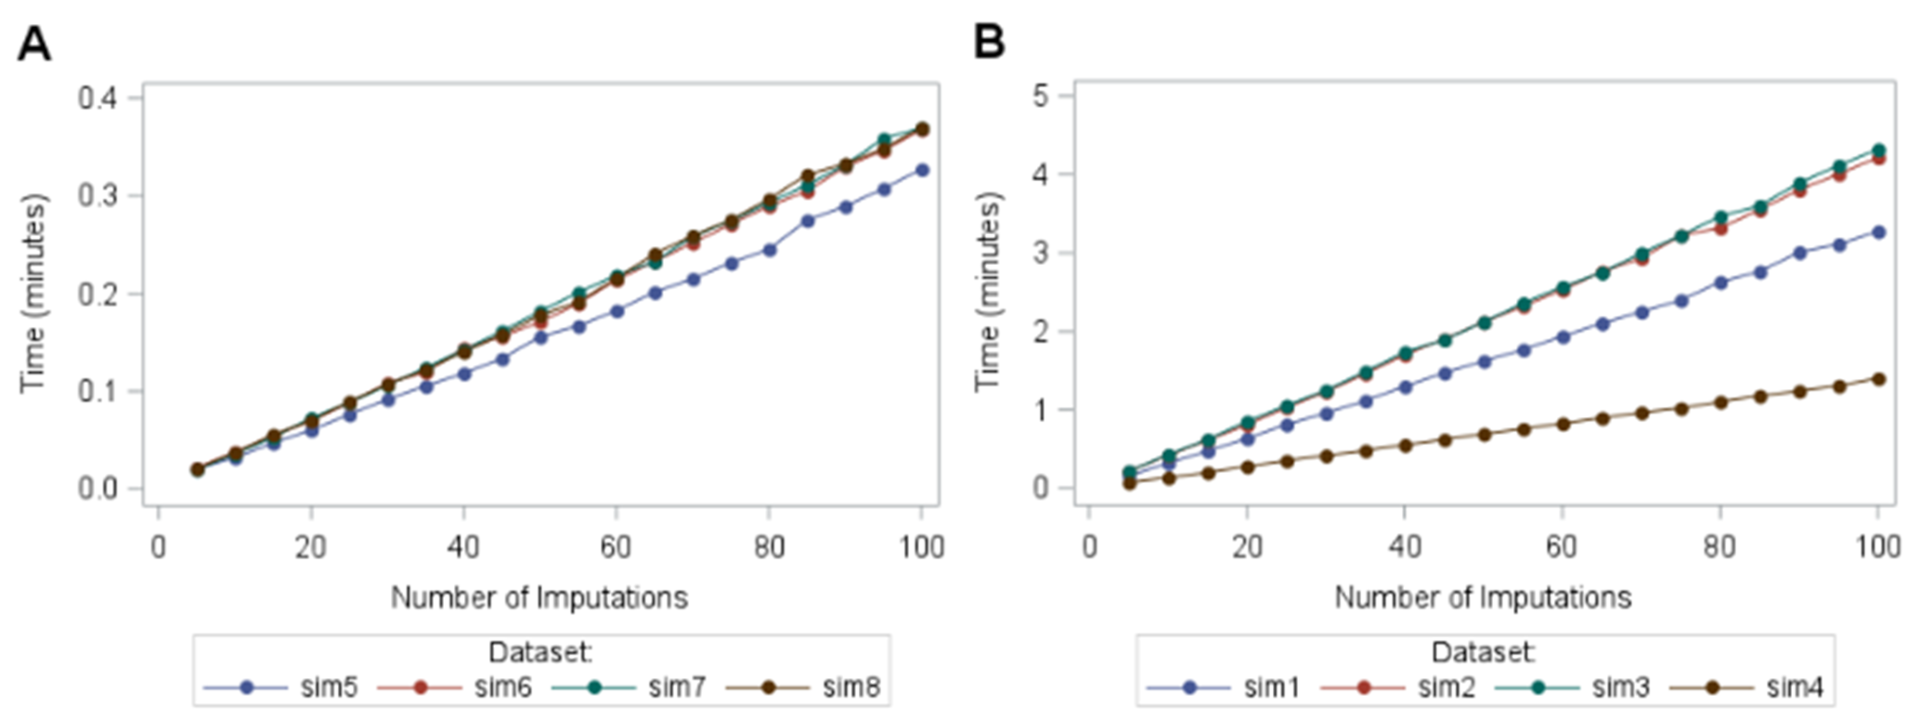
Figure 1: line graph of time taken in minutes for the macro to run for each dataset by number of imputations while under censored at random assumption. Figure 3A shows datasets with sample size=1000 and Figure 3B shows datasets with sample size=4000.
The mean (SD) runtime for 50 imputations and a sample size of 1000 (Figure 1A) was 0.17 (0.011) minutes compared to 1.64 (0.672) minutes with a sample size of 4000 (Figure 1B). This increase in runtime is disproportionate compared to the increase in sample size. Hence, as sample size increases, the runtime increases. It is also clear from Figure 1 that increasing the number of imputations also increases the runtime.
The runtime did not increase linearly with the percentage of censored subjects. Instead, an extra analysis was run with 81 newly simulated datasets with censoring percentages ranging from 0.2% to 74.5%. The runtime hit a peak at around 50% censoring indicating a peak of computational intensity.
Study length did not influence the runtime of the macro when considering the censoring percentage. Similar trends were observed when running a tipping point analysis which included 363 penalty combinations for datasets sim5, sim6, sim7 and sim8 over 5-100 imputations (increments of 5).
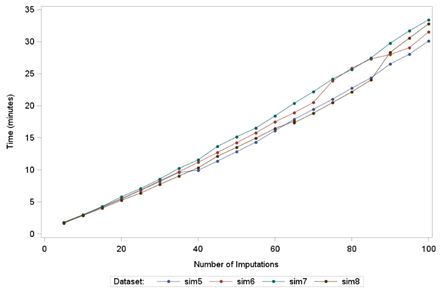
Figure 2: line graph of time taken in minutes for the macro to run for each dataset by number of imputations for a tipping point analysis.
Increasing the number of imputations for a tipping point analysis also increases the runtime (Figure 5). The mean (SD) runtime for 50 imputations and a sample size of 1000 was 13.94 (0.991) minutes. Since the mean (SD) runtime for 50 imputations and a sample size of 1000 for only one penalty combination was 0.17 (0.011) minutes, the expected runtime for 363 penalty combinations would be 61.71 minutes, assuming the increase would be directly proportional. Therefore, runtime increases disproportionately with the increase in penalty combinations.
Conclusions
When running under the censoring at random assumption, the tool gave consistent results to a Cox proportional hazards model estimated from the observed (not imputed) data. 50 imputations were chosen as this gave stable results without affecting computational efficiency. From testing the computational error of the macro, imputed HR did not vary more than 0.00004 from the observed HR. Therefore, the macro produces consistently plausible penalised results and is appropriate for use in future tipping point analyses.
The runtime of the macro hit a peak at around 50% censoring indicating a peak of computational intensity. The increase in runtime between datasets of 1000 subjects compared to 4000 subjects was disproportional. Runtime increased linearly with number of imputations.
The tool is efficient and user-friendly for carrying out tipping point analysis in SAS.
References
- Jackson D., White I. R., Seaman S., Evans H., Baisley K., and Carpenter J. (2014), Relaxing the independent censoring assumption in the Cox proportional hazards model using multiple imputation, Statist. Med., 27, 4681–4694. DOI: 10.1002/sim.6274
- Rubin DB. Multiple Imputation for Nonresponse in Surveys. Wiley: New York, 1987