
Psoriasis is an inflammatory disease characterised by lesions on the skin and has a prevalence of around 2% in the global population. To date, a Phastar client has conducted three randomized placebo-controlled trials with their study drug, all achieving a p-value <0.001 demonstrating efficacy. There are a variety of methods to treat skin conditions that are available and whilst our client’s treatment showed strong efficacy performance compared to placebo, there was a lack of head-to-head comparison to active treatment alternatives.
A literature review was conducted to identify randomized controlled trials of topical therapies in plaque psoriasis. The results yielded 79 trials comparing 23 active treatments. A network meta-analysis was suggested to analyse the data using a Bayesian methodology. This facilitated indirect effect calculations of missing direct comparisons between treatments. One benefit of this indirect treatment comparison is avoiding the need to invest time, money and further experimental burden compared to additional clinical trials. A network meta-analysis has the potential to find interesting connections between treatments and provide data driven targets to collect further evidence.
A key disadvantage is that the results produced are observational. Further, the results can be heavily skewed by the literature review, particularly due publication bias. Trials tend to only publish results where a significant effect is found, favouring large studies and a heavy bias towards the English language.
The PRISMA (Preferred Reporting Items for Systematic Reviews and Meta-Analyses) were followed to conduct the network meta-analysis which is a unified framework designed to reduce bias [1].
The data from the systematic literature review were grouped into data deemed combinable by the analyst. Trials that were analysing the same population, using the same response definition, and taken at the same or clinically similar timepoints were deemed combinable.
The question is, what constitutes combinable data?
This was determined looking at 3 factors:
- Endpoint
- Population of interest
- Timeout of measurement
Regarding endpoints, there are a vast array of endpoint measurements used in the area and this caused the most problems. These included, but not limited to, percentage of body area covered, the Psoriasis Area and Severity Index (PASI) which ranges from 0 to 72, or a 5/6-point Likert scale assessing plaque thickening, scaling and erythema. Efficacy was measured as a binary endpoint of achieving a low enough PASI score or scoring 0 on the Likert scale.
Due to there not being a consensus endpoint to use in studies, there was a balance in the number of trials in terms of which endpoints were used. This reduced the pool of studies that could be used to create a network.
Some trials did focus their inclusion criteria to a particular subgroup and there were also differences in the timepoint at which efficacy measurements were taken. These ranged from a fortnight, a month, and in one study a year follow-up.
After taking this into account, the best-case scenario we found was to combine the 5- and 6-point Likert scale endpoints at week 8 for the overall population. This yielded 24 studies of 12 active treatments. This is presented in Figure 1 below showing a network map of how the treatments link together in a network.
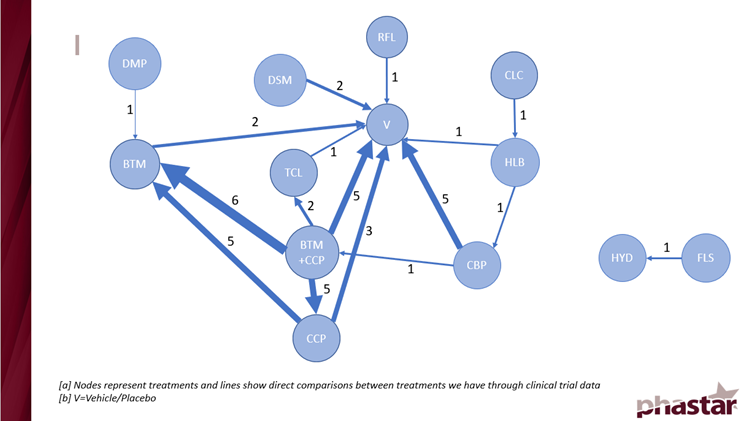
Figure 1: A network map showing the direct treatment interactions
The immediate result of Figure 1 was the presence of a disjointed network. 2 treatments were automatically removed from the analysis because there were no direct links to the main network that would allow for calculation of indirect comparisons.
Secondly, the map was weighted to the treatments in the bottom left corner where most of the trial results were. This affected the model performance.
Bayesian mixed effect models were used to conduct the network meta-analysis. A range of non-informative priors were used due to no previous information being available to incorporate. Unfortunately, the MCMC algorithm struggled to converge even when using a large number of simulations with significant thinning. There were 3 main reasons for this:
- extreme observations affecting the calculation of the log odds ratio
- small sample sizes in some trials
- low connectivity between direct treatment comparisons
A total of 32 analyses were conducted similar to the network presented in Figure 1 for a variety of outcomes and timepoints of interest. These were on a smaller network due to the combinable data being smaller. While the MCMC iterations struggled to converge, results comparing treatments were still able to be calculated albeit with most effect estimates having large confidence intervals. There were some confidence intervals that were meaningful which did provide us with some information. These were for parts of the network that had stronger connections.
The Bayesian framework did allow for a ranking of the treatments for each endpoint and timepoint of interest which yielded results showing a clear favourite treatment in most cases.
To conduct a future network meta-analysis my suggestions would be to ensure a consensus endpoint exists within the disease of interest to measure the outcome, be it efficacy or safety. The aim would be to allow for as large of a network as possible to be built with strong connections.
Whilst this analysis may have struggled to provide indirect comparisons with meaningful confidence intervals, under the right conditions, results from a network meta-analysis can be useful to drive decisions for future trials and provide direction to sponsors regarding the performance of their treatments against competition.
References
[1] Page M J, McKenzie J E, Bossuyt P M, Boutron I, Hoffmann T C, Mulrow C D et al. The PRISMA 2020 statement: an updated guideline for reporting systematic reviews BMJ 2021; 372 :n71 doi:10.1136/bmj.n71